| Poster | Thread |
 tomazkid tomazkid
 |  |
Re: Global Warming Vol. 2
Posted on 22-Jan-2009 0:44:52
| | [ #121 ] |
|
|
 |
Team Member
 |
Joined: 31-Jul-2003
Posts: 11694
From: Kristianstad, Sweden | | |
|
| @Dandy
One gas that is even more "dangerous" regarding GW, is Methane (CH4).
Methane Global Average increasing.
One common source of Methane is cows, but the melting of the the Arctic tundra is another source, which seems to be more worrying, since the more it melts, the more Methane gets outs, which makes it even warmer increasing the Methane output, and so on. _________________
Site admins are people too..pooff! |
|
| Status: Offline |
|
|
BrianK
| |
Re: Global Warming Vol. 2
Posted on 22-Jan-2009 3:39:47
| | [ #122 ] |
|
|
 |
Elite Member
 |
Joined: 30-Sep-2003
Posts: 8111
From: Minneapolis, MN, USA | | |
|
| @TMTisFree
Quote:
| Data do not clearly show a trend in ice area: |
Graphs are all nice but more importantly is what is the data set here and how was that data set arranged.
Reading more about one of your earlier references it appears that ice area on antartica was taken through counting pixels in a picture. One would have the question the accuracy of this method. Especially from 1979 vs 2009. I'd assume they replaced the satellites. Likely with a different parallax and different camera. One unless we see this data and it's handling we don't know how well or bad the chart marker adjusted for instrumentation differences.
Area itself is interesting as your earlier article talked about the ice reflecting sun light. I think one area might be more important is that of volume. Is the volume (depth of coverage) the same across this unchanged area? If not how much did it change and what is the impact of this change?
Sorry a couple of questions that a graph is too simplistic for us to do any real analysis on. The best we can do is assume everything is kosher in denmark but we need to the details to verify. |
|
| Status: Offline |
|
|
Dandy
| |
Re: Global Warming Vol. 2
Posted on 22-Jan-2009 9:40:21
| | [ #123 ] |
|
|
 |
Elite Member
|
Joined: 24-Mar-2003
Posts: 3049
From: Cologne * Germany | | |
|
| @tomazkid
Quote:
tomazkid wrote:
@Dandy
One gas that is even more "dangerous" regarding GW, is Methane (CH4).
Methane Global Average increasing.
One common source of Methane is cows, but the melting of the the Arctic tundra is another source, which seems to be more worrying, since the more it melts, the more Methane gets outs, which makes it even warmer increasing the Methane output, and so on.
|
Yeah - and not to forget the METHANE HYDRATE ICE deposits at the ground of the oceans, which are equally warming...
 Last edited by Dandy on 22-Jan-2009 at 09:45 AM.
_________________
Ciao
Dandy
__________________________________________
If someone enjoys marching to military music, then I already despise him.
He got his brain accidently - the bone marrow in his back would have been sufficient for him!
(Albert Einstein) |
|
| Status: Offline |
|
|
TMTisFree
| |
Re: Global Warming Vol. 2
Posted on 22-Jan-2009 10:48:11
| | [ #124 ] |
|
|
 |
Super Member
 |
Joined: 6-Nov-2003
Posts: 1487
From: Nice, so nice | | |
|
| @tomazkid
Quote:
tomazkid wrote:
@TMTisFree
The problem with these temperature measurements is that they only cover 100 years (a bit longer sometimes).
The Greenland for example was "discovered" over 1000 years ago by the Vikings, who named it Greenland, since it had mild climate with trees and herbaceous plants growing and livestock being farmed.
(According to Wikipedia).
Then the "little Ice Age" came, a cold period that lasted 400 years, and Greenland wasn't so green anymore.
Anyway, for a longer scale temperature comparison, take a look at this at Wikipedia, it estimates 2000 years, and this one amazing 12000 years.
|
I just wanted to illustrate that something as simple as measuring a temperature can be biased very easily and that corrections for these biases are not done properly or at all although they are very easy to apply and known since 36 years.
See for ex.:

Quote:
| Since the beginning of 2003, RSS has been dropping at 3.60C/century, UAH has been dropping at 2.84C/century, and GISS has been dropping at 0.96C/century. |
Source and here (interactive graph plot with data)
About temperature reconstructions from the past, they are all done through proxies, and are so indirect and subject to qualitative and quantitative interpretations (non-reconciliation). Most proxies (and multi-proxies) data/studies were contaminated (ice core) or irrelevant (tree-ring), not speaking of data and statistical manipulations, approximations and errors, and conclusions not independently confirmed (especially by Mann et alter).
Bye,
TMTisFree_________________
The engineering approach to our non-problems: "build a better washer".
The scientific approach to our non-problems: "find a new energy source".
The environmentalist approach to our non-problems: "stop washing your shirts". |
|
| Status: Offline |
|
|
TMTisFree
| |
Re: Global Warming Vol. 2
Posted on 22-Jan-2009 12:09:17
| | [ #125 ] |
|
|
|
Super Member
|
Joined: 6-Nov-2003
Posts: 1487
From: Nice, so nice | | |
|
| |
| Status: Offline |
|
|
BrianK
| |
Re: Global Warming Vol. 2
Posted on 22-Jan-2009 13:00:18
| | [ #126 ] |
|
|
|
Elite Member
|
Joined: 30-Sep-2003
Posts: 8111
From: Minneapolis, MN, USA | | |
|
| @TMTisFree
Quote:
Quote:
| ice area on antartica was taken through counting pixels in a picture. One would have the question the accuracy of this method. |
How do you think data are collected from satellite imagery? |
I don't think I ever disputed that was how an area is taken from a satellite photo. What the problem is is the adjustments in the data. What's the error factor here? You've been doing lots of work showing errors in thermometers. Is there no error here? Of course not the accuracy of a 30m resolution vs 1m resolution is different. Certainly areas of North and South poles have plane aerial photography. How were these all compared? Again my point was good questions that a single map w/o discussion of data collection and analysis fails to enlighten.
Quote:
| Sea ice volume accounts for ~2% from a total of about 30 000 000 km3 of ice (sea+ground). Changes in volume are very uncertain (some values are based on models). |
Isn't there any changes to ground ice volume? I know here it snows different amounts in different years. Snow piles up and snow melts away.
Quote:
| Anyway, even if all sea ice melts, sea level will not change: the mass of this ice is equal to that of the water it displaces. |
Is there no change in volume in the other 98% land mass?
I think a good question is what are the expected warming effects in Antartica. If we warm from -40 to -10 the air is warmer. Warmer air carries more moisture. More moisture leads to precipitation. One would think a slight growth effect would be expected until we start reaching temps over 32. So wouldn't warming expect a growth (as your graphs displayed) in Antartica? Of course this doesn't answer what caused the warming.
Overall for Antartica my understanding is the changes are just beginning to be studied. I don't know if we can look at 2% sea ice area and assume that's the only thing changing. Volume may be very important and unless we try to measure that too and see if there are effects we won't know.
Quote:
| Anyway, even if all sea ice melts, sea level will not change: the mass of this ice is equal to that of the water it displaces. |
Take a a glass of water with ice and let all the ice melt. Doesn't the level go down? Well and again sea ice is 2% if the other 98% has some melting then surely because that's not in the sea when it runs off to the sea the level will increase. Again I think looking at 2% ice and assuming the other 98% is stagnet might not be the right answer. We need to look at the other 98% to see what it's doing.
|
|
| Status: Offline |
|
|
TMTisFree
| |
Re: Global Warming Vol. 2
Posted on 22-Jan-2009 13:44:56
| | [ #127 ] |
|
|
|
Super Member
|
Joined: 6-Nov-2003
Posts: 1487
From: Nice, so nice | | |
|
| @Dandy
Quote:
| And annother question is which of the factors that contribute to global warming can be manipulated by mankind to successfully attenuate the consequences of GW and which not, I'd say. |
One can certainly put the cart before the horse. What would be a progress, would be a reconciliation between ground-based records and satellites/radiosondes (balloons)-based records for temperature to precisely quantify the amount of GW that occurred since 1979: ground series show a warming trend of >0.20°C per decade, significantly greater than the trend from radiosondes and satellites (~0.1°C), both having been audited. No comparable audit has been conducted on the surface-based series which are full of errors: UHI (see previous posts), biases due to placement, land use changes, wind speed and humidity gradients, etc. There are plenty of paper demonstrating these biases. Nevertheless, NOAA still claims that the surface record is the strongest dataset that demonstrate significant warming since the 1970s while in the same time devotes only a 10% man year to QA of the surface weather stations...It is a real shame that private persons have to investigate this central problem neglected by the multimillion $ public agencies that are responsible for:
Below is the quality rating of surface stations (60% of the network): lower is best:

Miserable is the word.
Bye,
TMTisFreeLast edited by TMTisFree on 22-Jan-2009 at 01:50 PM.
_________________
The engineering approach to our non-problems: "build a better washer".
The scientific approach to our non-problems: "find a new energy source".
The environmentalist approach to our non-problems: "stop washing your shirts". |
|
| Status: Offline |
|
|
TMTisFree
| |
Re: Global Warming Vol. 2
Posted on 22-Jan-2009 16:43:20
| | [ #128 ] |
|
|
|
Super Member
|
Joined: 6-Nov-2003
Posts: 1487
From: Nice, so nice | | |
|
| @BrianK
Firefox crashed and I lost all my responses to your post above, I'm too lazy to redone it entirely, sorry. Below are the key points:
Quote:
| What the problem is is the adjustments in the data. What's the error factor here? |
Procedures from NOAA are not public: request them.
Quote:
| Isn't there any changes to ground ice volume? I know here it snows different amounts in different years. Snow piles up and snow melts away. |
I was writing about sea ice. Of course there are regional changes in grounded-ices.
Quote:
| Is there no change in volume in the other 98% land mass? |
Globally, almost null (below 0.01%).
Quote:
| Take a a glass of water with ice and let all the ice melt. Doesn't the level go down? |
There is no change in the level. The ice floats because it displaces a volume of water which weights as much as the ice. When the ice melts, it turns into water, that will occupy the same volume. See here.
Bye,
TMTisFree_________________
The engineering approach to our non-problems: "build a better washer".
The scientific approach to our non-problems: "find a new energy source".
The environmentalist approach to our non-problems: "stop washing your shirts". |
|
| Status: Offline |
|
|
BrianK
| |
Re: Global Warming Vol. 2
Posted on 23-Jan-2009 4:25:17
| | [ #129 ] |
|
|
|
Elite Member
|
Joined: 30-Sep-2003
Posts: 8111
From: Minneapolis, MN, USA | | |
|
| @TMTisFree
Quote:
@BriankQuote:
| Is there no change in volume in the other 98% land mass? |
Globally, almost null (below 0.01%). |
I thought we were talking changes to ice in Antarctica and if the reference of the problem is really better to talk about using area or using volume?
Here is one article.
Interior Antarctica Ice Sheet gaining mass...The overall contribution of the Antarctic ice sheet to global sea-level change will depend on how mass changes in the ice sheet's interior balance mass changes from the coastal areas." ... Could it be ice mass (volume as I called it) is a factor to ocean rising and lowering more so than area?
|
|
| Status: Offline |
|
|
TMTisFree
| |
Re: Global Warming Vol. 2
Posted on 23-Jan-2009 10:23:24
| | [ #130 ] |
|
|
|
Super Member
|
Joined: 6-Nov-2003
Posts: 1487
From: Nice, so nice | | |
|
| @BrianK
Quote:
| I thought we were talking changes to ice in Antarctica and if the reference of the problem is really better to talk about using area or using volume? |
Quote:
| Could it be ice mass (volume as I called it) is a factor to ocean rising and lowering more so than area? |
What I wrote yesterday is that, in Antartica, the center and East globally gain ice mass (or volume) because of more snow while the West part loses volume, probably due to sub-glacial volcanic activities (Hugh Corr in Nature Geoscience 2008). Ice area is easy to measure/follow and is mainly used for sea ice (sea ice volume is theoretically irrelevant, see previous post), while volume measurements need more advanced technologies and is used for grounded-ice (area do not change). Intuitively, the more land-based ice volume you have, lesser is the water volume, so sea level tends to decrease. So yes, (ground-based) volume theoretically is the variable that is mainly connected to sea level. But it is not known if the increase in snow precipitation is due to historical event(s)/natural variabilities, or other (known or unknown) events. So sea level prediction range can be/is rather large.
Bye,
TMTisFree_________________
The engineering approach to our non-problems: "build a better washer".
The scientific approach to our non-problems: "find a new energy source".
The environmentalist approach to our non-problems: "stop washing your shirts". |
|
| Status: Offline |
|
|
TMTisFree
| |
Re: Global Warming Vol. 2
Posted on 23-Jan-2009 12:30:23
| | [ #131 ] |
|
|
|
Super Member
|
Joined: 6-Nov-2003
Posts: 1487
From: Nice, so nice | | |
|
| @TMTisFree
Sea level modifications have other causes than just ice melting: thermal expansion, changes in salinity, water circulation, ground level movement (isostatic rebounds), etc.
The current (almost real time, satellite-based altimetry) trend in mean sea level rise is:

Note that these values are corrected with somewhat public procedures (see the order of magnitude errors here) and that the accuracy of these measurements has been questioned: data may only indicate a 1.6mm/yr increase as has been noted by several authors. Interestingly, older tide gauge data continues to show about a 2 mm/yr rise.
Note also that there is an interesting apparent pause since 2005 and that most of the signal since 2002 comes from the Indian Ocean (5mm/yr) while other oceans are being almost flat or decrease.
Bye,
TMTisFree
Last edited by TMTisFree on 23-Jan-2009 at 12:35 PM.
_________________
The engineering approach to our non-problems: "build a better washer".
The scientific approach to our non-problems: "find a new energy source".
The environmentalist approach to our non-problems: "stop washing your shirts". |
|
| Status: Offline |
|
|
BrianK
| |
Re: Global Warming Vol. 2
Posted on 23-Jan-2009 13:02:27
| | [ #132 ] |
|
|
|
Elite Member
|
Joined: 30-Sep-2003
Posts: 8111
From: Minneapolis, MN, USA | | |
|
| @TMTisFree
Thanks I agree. Mass of land ice (98% of the ice in Antarctica) is going to contribute to the change in oceans more than the 2% sea based ice. In this case area means little.
Timely article Antarctica is warming |
|
| Status: Offline |
|
|
TMTisFree
| |
Re: Global Warming Vol. 2
Posted on 23-Jan-2009 14:41:12
| | [ #133 ] |
|
|
|
Super Member
|
Joined: 6-Nov-2003
Posts: 1487
From: Nice, so nice | | |
|
| @BrianK
Quote:
BrianK wrote:
@TMTisFree
Thanks I agree. Mass of land ice (98% of the ice in Antarctica) is going to contribute to the change in oceans more than the 2% sea based ice. In this case area means little.
Timely article Antarctica is warming |
This is probably the recent to-be-published-paper by Steig (with Mann and Co) and claiming GW (based on "deduced" temperatures) in Antartica (with large press release, full blogosphere coverage and high media attention, a convenient timing just before Al Gore's speech to Congress) while forgetting volcanoes activities and other phenomenons in this small part of Antartica...typical.
A letter sent yesterday to the paper's lead author by a meteorologist on the ground of Antartica is as follows (extracts):Quote:
...I feel your study is absolutely wrong.
...in Antarctica the summer seasons have been getting colder...
There was a paper presented at the AMS Conference in New Orleans last year noting over 70% of the continent was cooling...
With statistics you can make numbers go to almost any conclusion you want. It saddens me to see members of the scientific community do this for media coverage... |
Their 'finding' is a trend of 0.17+/-0.06 °C/decade for the West part of Antartica. Abstract of the paper is here, btw.
It is worth adding that temperature in Antartica is usually below -50°C with -60°C in june and august 2008 (2008 weather in Antartica).
Bye,
TMTisFree
Last edited by TMTisFree on 23-Jan-2009 at 05:13 PM.
Last edited by TMTisFree on 23-Jan-2009 at 04:12 PM.
_________________
The engineering approach to our non-problems: "build a better washer".
The scientific approach to our non-problems: "find a new energy source".
The environmentalist approach to our non-problems: "stop washing your shirts". |
|
| Status: Offline |
|
|
TMTisFree
| |
Re: Global Warming Vol. 2
Posted on 23-Jan-2009 17:11:57
| | [ #134 ] |
|
|
|
Super Member
|
Joined: 6-Nov-2003
Posts: 1487
From: Nice, so nice | | |
|
| @BrianK
Below is a quote from World Climate report in september 2007, describing the 'warming' problem of Antartica:
Quote:
Here is the interesting twist to the story. Notice in the graph of seasonal and annual temperature trends that the coldest years occurred at or near the beginning of the record.
Chapman and Walsh find “Trends computed using these analyses show considerable sensitivity to start and end dates with starting dates before 1965 producing overall warming and starting dates from 1966 to 1982 producing net cooling rates over the region.”
Incredibly, if you are interested in Antarctica temperature trends from the present back to 1982, the region has cooled. If you go from present back to 1966, the region has cooled. Like it or not, over the past four decades, and during the time of the greatest build-up of greenhouse gases, Antarctica has been cooling! |
(Bold by me)
It is one of the data/statistical twists (also with the computer filling of missing data) that Mann and Co have been used repeatedly with their tree-rings reconstructions of past temperature data.
I'm all but impressed.
Bye,
TMTisFree
_________________
The engineering approach to our non-problems: "build a better washer".
The scientific approach to our non-problems: "find a new energy source".
The environmentalist approach to our non-problems: "stop washing your shirts". |
|
| Status: Offline |
|
|
TMTisFree
| |
Re: Global Warming Vol. 2
Posted on 24-Jan-2009 15:10:39
| | [ #135 ] |
|
|
|
Super Member
|
Joined: 6-Nov-2003
Posts: 1487
From: Nice, so nice | | |
|
| @tomazkid
Quote:
tomazkid wrote:
@Dandy
One gas that is even more "dangerous" regarding GW, is Methane (CH4).
Methane Global Average increasing.
One common source of Methane is cows, but the melting of the the Arctic tundra is another source, which seems to be more worrying, since the more it melts, the more Methane gets outs, which makes it even warmer increasing the Methane output, and so on. |
The CH4 concentration is somewhat stable since 10 years:

It is interesting to note that northern and southern curves' shapes are inverted (mirror pattern).
Bye,
TMTisFree_________________
The engineering approach to our non-problems: "build a better washer".
The scientific approach to our non-problems: "find a new energy source".
The environmentalist approach to our non-problems: "stop washing your shirts". |
|
| Status: Offline |
|
|
BrianK
| |
Re: Global Warming Vol. 2
Posted on 24-Jan-2009 15:19:22
| | [ #136 ] |
|
|
|
Elite Member
|
Joined: 30-Sep-2003
Posts: 8111
From: Minneapolis, MN, USA | | |
|
| @TMTisFree
Quote:
| A letter sent yesterday to the paper's lead author by a meteorologist on the ground of Antartica is as follows |
One note if you want to use things can you provide a link to the article? This allows us to read all of the author's opinions and not just your selected favorites line. Hayes Letter to Editor
Finding and reading this Letter to the Editor (hardly a scientific paper) Ross Hayes includes an anecdote of a helicopter no longer being used to 1 base for the last couple of summers. There's no measure of the temps shown here to prove his point is correct. Ross Hays goes on to criticize Steig because the temps come from the temp stations which are around the perimeter of antarctica. Probably a fair criticism but the anecdote above is even a smaller sample set and therefore even more in question. There's nothing in the article to show us the perimeter temps and handling was wrong. It does appear to me to be mostly opinion and no real scientific data was provided to back up Hayes point of view.
Looking at the criticism I think it raises some issues to look at but doesn't in itself provide a scientific disproval of the paper. I hope Hayes does the work to show in detail how Steig was wrong. That's what science is all about taking the data, predicting the outcomes, and working in the criticisms to move towards a better conclusion.
Reading more on Antarctica it seems like an analysis is problematic due to the temp stations being around the perimeter and little to none in the interior. The later is strongly likely due to the even colder climate. Hard to get probes there and hard to ensure they continue to function. Seems most any analsys is going to fall short until some better interior data is established.
Quote:
| It is worth adding that temperature in Antartica is usually below -50°C with -60°C in june and august 2008 |
I believe June-Aug is their winter (coldest temps). As we in the Northern Hemisphere have summer(warmest temps). Last edited by BrianK on 24-Jan-2009 at 03:25 PM.
|
|
| Status: Offline |
|
|
BrianK
| |
Re: Global Warming Vol. 2
Posted on 24-Jan-2009 15:42:36
| | [ #137 ] |
|
|
|
Elite Member
|
Joined: 30-Sep-2003
Posts: 8111
From: Minneapolis, MN, USA | | |
|
| @TMTisFree
Quote:
| The CH4 concentration is somewhat stable since 10 years: |
Again graphs with no data to look at? It appears these graphs are of 2 locations. Isn't methane unevenly distributed throughout the atmosphere? Here's an image showing distribution. Seems like cherry picking data is likely in play when we only look at 2 locations and compare them.
Here is some interesting data Methane is increasing again. Quote:
| One surprising feature of this recent growth is that it occurred almost simultaneously at all measurement locations across the globe |
Now this is a bit more interesting to me we're not talking about 2 cities but a reflection of multiple meausres around the globe.
I think I can reflect this idea back on the measure of Antarctica. Hayes problem with Steig is that the temp data is biased by an abundance of perimeter data on that continent. 2 cities in 1 graph is unlikely to reflect the world activity. |
|
| Status: Offline |
|
|
Interesting
| |
Re: Global Warming Vol. 2
Posted on 24-Jan-2009 17:06:53
| | [ #138 ] |
|
|
 |
Super Member
|
Joined: 29-Mar-2004
Posts: 1812
From: a place & time long long ago, when things mattered. | | |
|
| @Dandy
Quote:
| Yeah - and not to forget the METHANE HYDRATE ICE deposits at the ground of the oceans, which are equally warming... |
Well we should tap that energy and burn it no?
 _________________
"The system no longer works " -- Young Anakin Skywalker |
|
| Status: Offline |
|
|
TMTisFree
| |
Re: Global Warming Vol. 2
Posted on 24-Jan-2009 17:30:52
| | [ #139 ] |
|
|
|
Super Member
|
Joined: 6-Nov-2003
Posts: 1487
From: Nice, so nice | | |
|
| @BrianK
The source of the letter was removed in my last edit for some reason. It is all over the web.
For the rest, see my previous post.
Edit: corrected post
Bye,
TMTisFree Last edited by TMTisFree on 25-Jan-2009 at 10:56 AM.
_________________
The engineering approach to our non-problems: "build a better washer".
The scientific approach to our non-problems: "find a new energy source".
The environmentalist approach to our non-problems: "stop washing your shirts". |
|
| Status: Offline |
|
|
TMTisFree
| |
Re: Global Warming Vol. 2
Posted on 24-Jan-2009 18:21:28
| | [ #140 ] |
|
|
|
Super Member
|
Joined: 6-Nov-2003
Posts: 1487
From: Nice, so nice | | |
|
| @BrianK
Quote:
| Again graphs with no data to look at? |
The source is in the image address itself. The data are here.
Quote:
| Here's an image showing distribution. |
Your image links to nothing. Just embed it in your post to be sure it displays correctly.
Quote:
| Isn't methane unevenly distributed throughout the atmosphere?...Seems like cherry picking data is likely in play when we only look at 2 locations and compare them. |
The two plots I gave:
are qualitatively identical (but mirrored) to the global one given by tomazkid: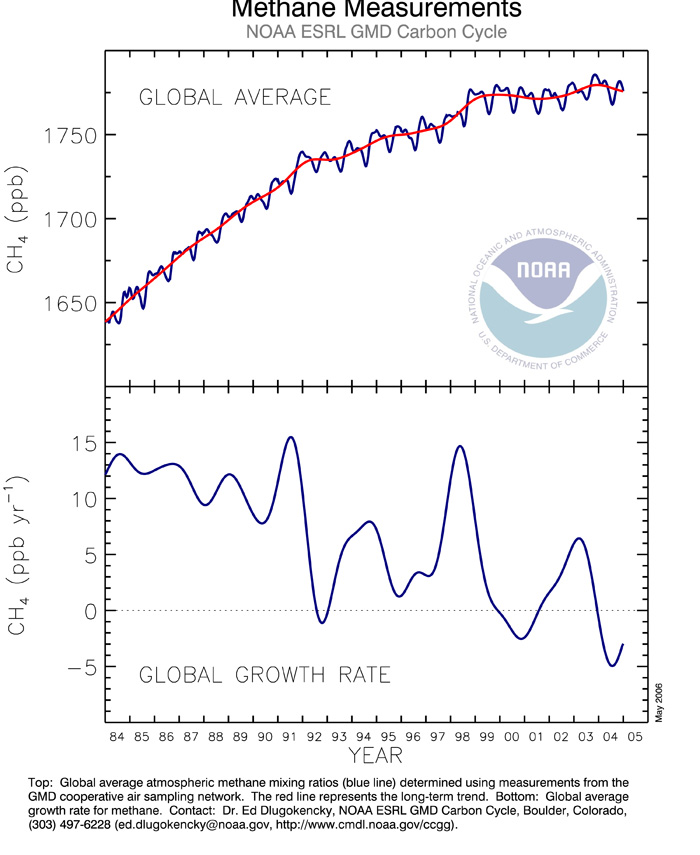
when you restrict your view to the last 10 years.
I am doing neither a statistical analysis of the 2 locations nor submitting a scientific paper to a peer-reviewer: I was just interested in the mirror pattern of the 2 curves, as I noted.
Quote:
| Methane is increasing again. |
One can see it in the image I provided, in the right end of the blue curve.
Quote:
| it occurred almost simultaneously at all measurement locations across the globe |
This is the most interesting part: is this increase the result of an increase of methane emission or a decrease in the rate of removal? In either case, what drives it? Ocean is perhaps, once again, at work: Aerobic production of methane in the sea.
Bye,
TMTisFree
Last edited by TMTisFree on 24-Jan-2009 at 06:35 PM.
Last edited by TMTisFree on 24-Jan-2009 at 06:24 PM.
_________________
The engineering approach to our non-problems: "build a better washer".
The scientific approach to our non-problems: "find a new energy source".
The environmentalist approach to our non-problems: "stop washing your shirts". |
|
| Status: Offline |
|
|


